API Strategies with Power BI
API (Application Programming Interface). You surely have heard the term from your enterprise architects telling you that all data will be accessed through “the API” and you will no longer access data from the source. They will build all the interfaces for you and you won’t need that source connectivity anymore.

Enterprise architects are really smart (I used to be one), ha. In all of the wisdom we share as architects, the confession is that making data accessible to our business analysts was never our top priority… All of the design documentation that we wrote started with “end user experience” and had a lot of content around “3 Tier Architecture”. Reporting and Business intelligence usually ended up as the last few paragraphs after a few dozen sections of content on how the application would work and interface with all the back-end systems.
I am writing this to give the perspective that more often than not, data connectivity is not forefront in most application designs. I do believe that is starting to change as data is becoming a financial currency to most organizations, but nonetheless, these “pesky” APIs still stand in between you and the data you need to access.
So, you have been given a nice long URL that starts with “https://” to access the data you need. Now what?
In this article, I will show how to connect to your APIs through Power BI in a few different ways. I will start by showing the ODATA protocol but will quickly dive deep into APIs that are secured by the popular OAuth protocol and end with how awesome Power BI transverses nested JSON documents that get returned.
Connecting to ODATA Services
The most well suited API strategy for connecting business intelligence tools is the ODATA protocol. When your organization’s APIs are presented as an ODATA feed then it has a standard implied that power bi can understand. OData can be offered either through the more modern REST standard or more traditional and still widely used SOAP standard.
There is a public ODATA feed for the Northwind sample data set here:
http://services.odata.org/northwind/northwind.svc/
To connect to ODATA feeds, simply go to “Get Data” -> “ODATA” and enter the URL.
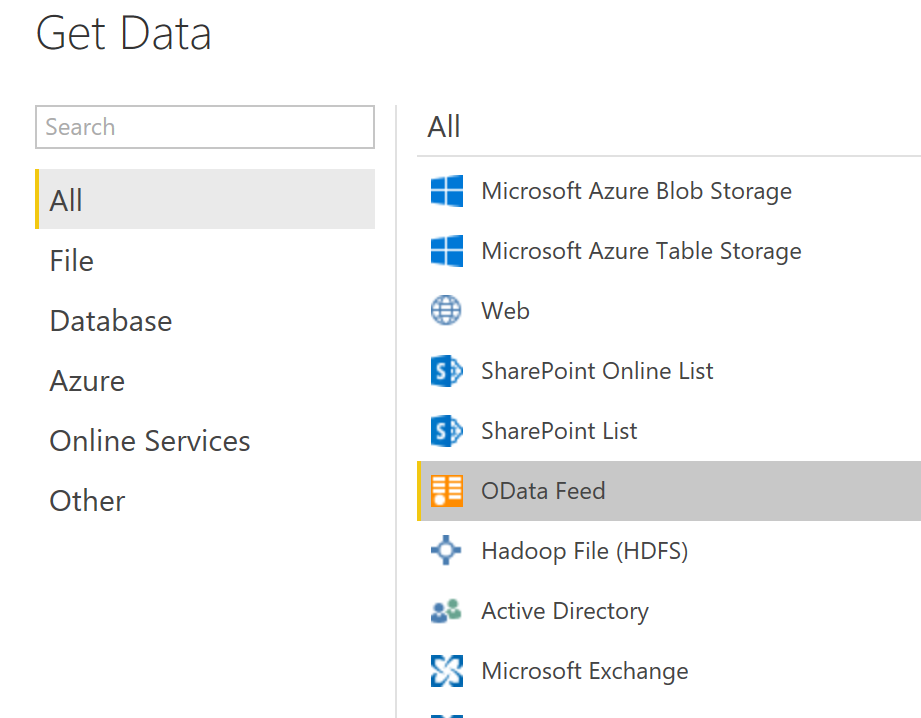
As this is a standard format for APIs, the benefit is that you are presented with a table list from the service just like you would be if you were connecting directly to a database.

Most APIs will have additional request parameters that can be added to get more specific data. The below url connects to the same service as above but returns only a single record:
http://services.odata.org/Northwind/Northwind.svc/Orders(10643)
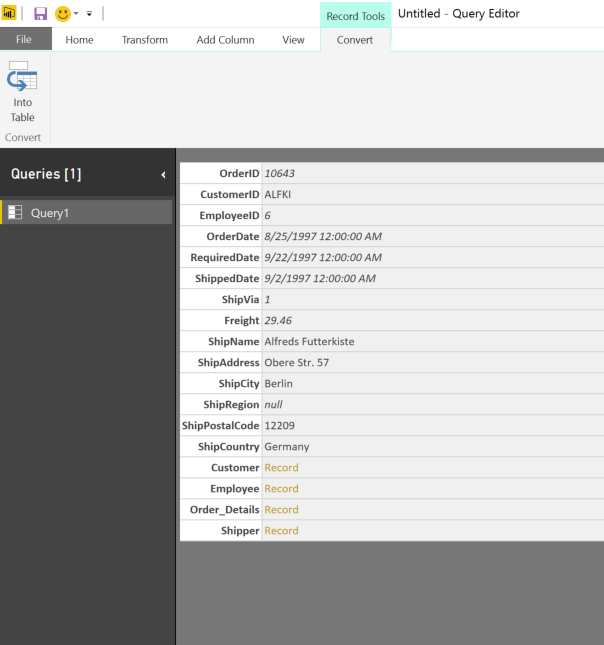
You have successfully just connected to your first API. From this point forward, ODATA behaves in the same way as other data sources and you can start shaping data in the “Edit Queries” window.
If you can influence your organization to adopt this standard for APIs, your life will be much easier consuming them. However, the purpose of this blog site is to help you use technologies such as Power BI in an enterprise scenario, and it is most likely that your APIs are not ODATA compliant…. So let’s get on with the FUN stuff.
Non ODATA APIs
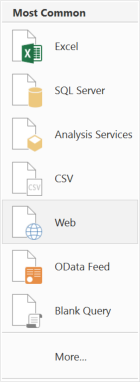
After you ask your architect if the API you are trying to connect to is ODATA compliant and she tells you NO, the next alternative is to use the Web data source.
When connecting to a web URL for your internal (or external API) it is likely going to be a secured and will have a prefix of “https” instead of “http”. In our ODATA example above, I did not connect to a secured service but had I, the below dialog would have been presented back.
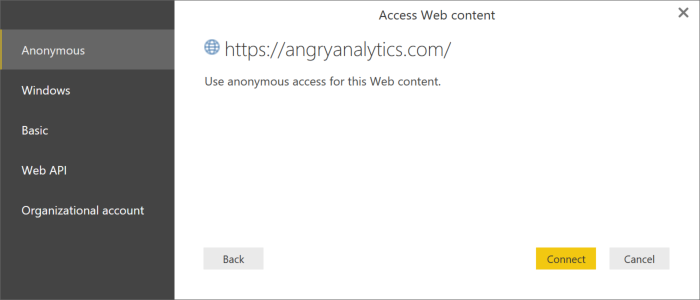
There are 5 different authentication methods that are quite easy to connect with. It is possible that internal APIs may use Basic or Windows credentials. Someone will have to provide to you a basic user/password combination for connecting to the service or if using Windows credentials someone will need to verify you have been granted access with your own user/password combination.
If connecting with one of these five authentication types, it is pretty straight forward and you can skip ahead to the end of this post where I show how to transverse the JSON documents that likely will be returned as a result.
Connecting to OAuth Services
Many organizations are moving towards OAuth authentication protocol. Notice in the screenshot above, this protocol is not natively supported in Power BI. This protocol has an extra layer of complexity as it requires two services. One service will be called with an api key and an api secret and will return a token to then be used with all subsequent requests to the resource URL.
We will get in the weeds rather quickly in the rest of this blog post so prior to the half of you that will stop reading at this point, please go to the Power BI Ideas site and VOTE for OAuth protocol to be added as a first class authentication provider. Here is the link: https://ideas.powerbi.com/forums/265200-power-bi-ideas/suggestions/13195278-oauth
Also, the below content is available in a Power BI Template file here. Read the content below but feel free to download the template to save a lot of the grunt work.
Setting up a Twitter App for our OAuth API Example
First of all, twitter connectivity via Power Query has already been blogged about a few times. The most useful post I found on it was by Chris Koester here. The script I am using later in this article is nearly identical to what I learned from his post. I will talk through the necessary script that has to be written but also focus on how you can transverse JSON data that gets returned from most modern APIs you will encounter.
Twitter uses OAuth2 for authentication. This will require you to setup a free developer account if you have not already.
Go to https://dev.twitter.com and sign in with your twitter account. You will then need to create a twitter application which will give us the necessary API Key and API Secret that will be used to authenticate with the twitter Search API.
In the new Twitter UI, the applications section is a little hard to find. At the bottom of https://dev.twitter.com are some links. On the right hand side you will see “Manage Your Apps”

You will see a “Create New App” button that will take you through a dialog to setup your application
Callback URL issue with OAuth based APIs
In the application creation dialog, you will notice a Callback URL entry that we will leave blank for this example.

In a traditional OAuth flow that has a UI associated with it, this is the URL that the flow will return user interaction back to after the user agrees to allow the application to act on their behalf. This blog is not meant to go into that detail but you can review this link for more information.
As with OAuth, we have to get an authentication token from the first service we are going to call, there is an issue with some apis as they only pass this token back to the Callback URL. Power BI cannot read a response returned to a callback URL and if the API you are using requires that “authentication flow” then it can’t be used with Power BI (well, that is not entirely true, but to prevent this blog from being 50 pages long, we will say it can’t). For instance, the LinkedIn API requires this flow so it is not something we can connect to from Power BI easily.
As long as the token is returned in the response from the first authentication service call (as the Twitter API does), we will be able to integrate it with Power BI.
Connecting to the Twitter Search API
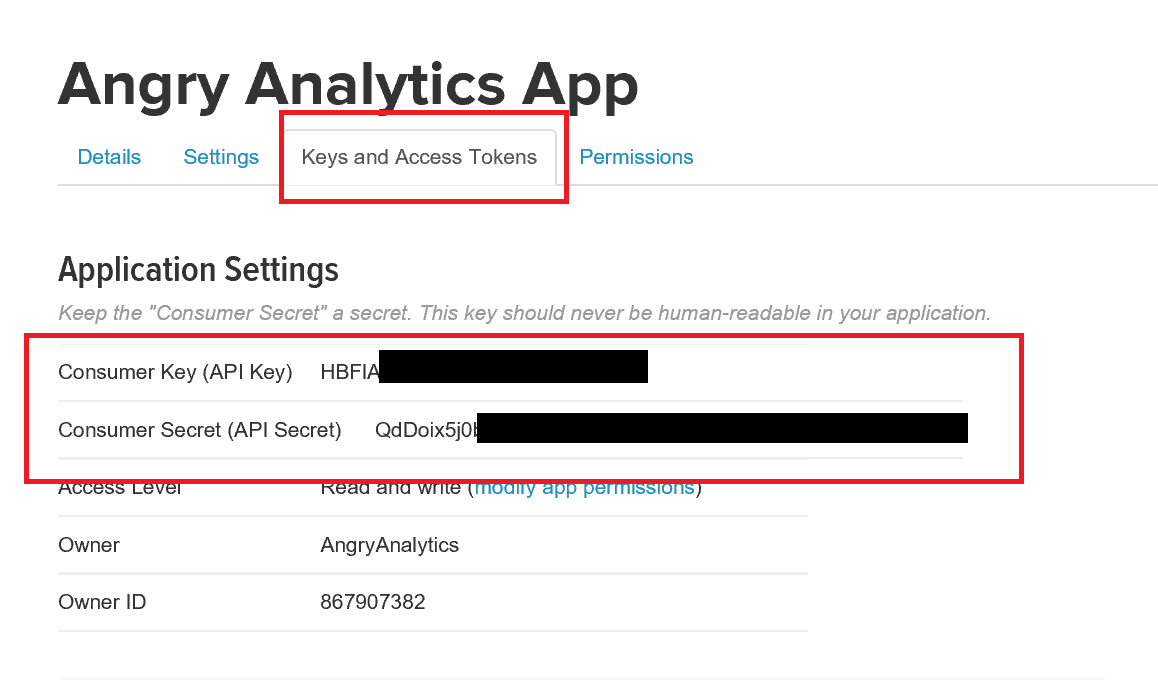
Once you have entered the data to create an application, you will land on your “App details” screen. Navigate to the “Keys and Access Tokens” tab and copy the API Key and Secret so they can be used later.
Note: These should be treated like passwords and not made public
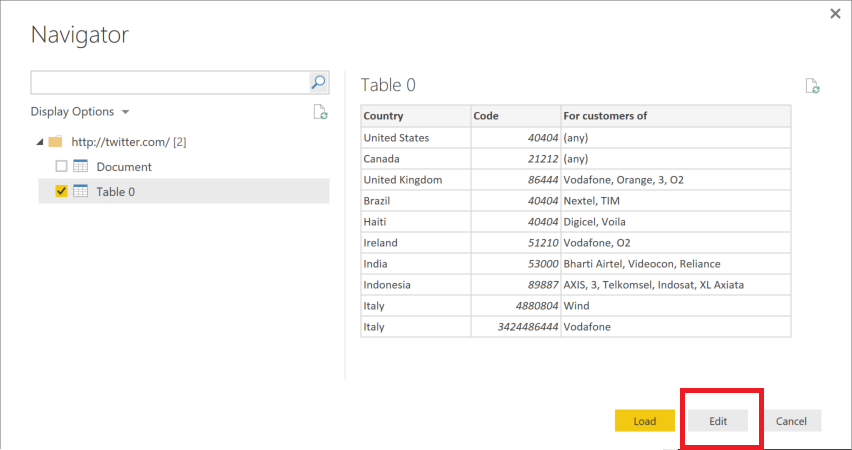
Back in Power BI, go back to the Web data source and we will just type in an arbitrary web URL as we will be replacing all of this with a script. I used http://twitter.com and was presented with the navigator dialog to select a table from that page. Click “Edit” to open the Query Editor.
It is a good time to take advantage of a new feature that was added in the April Power BI Desktop update for Parameters. For deeper insight on this feature, check out the power bi blog entry.
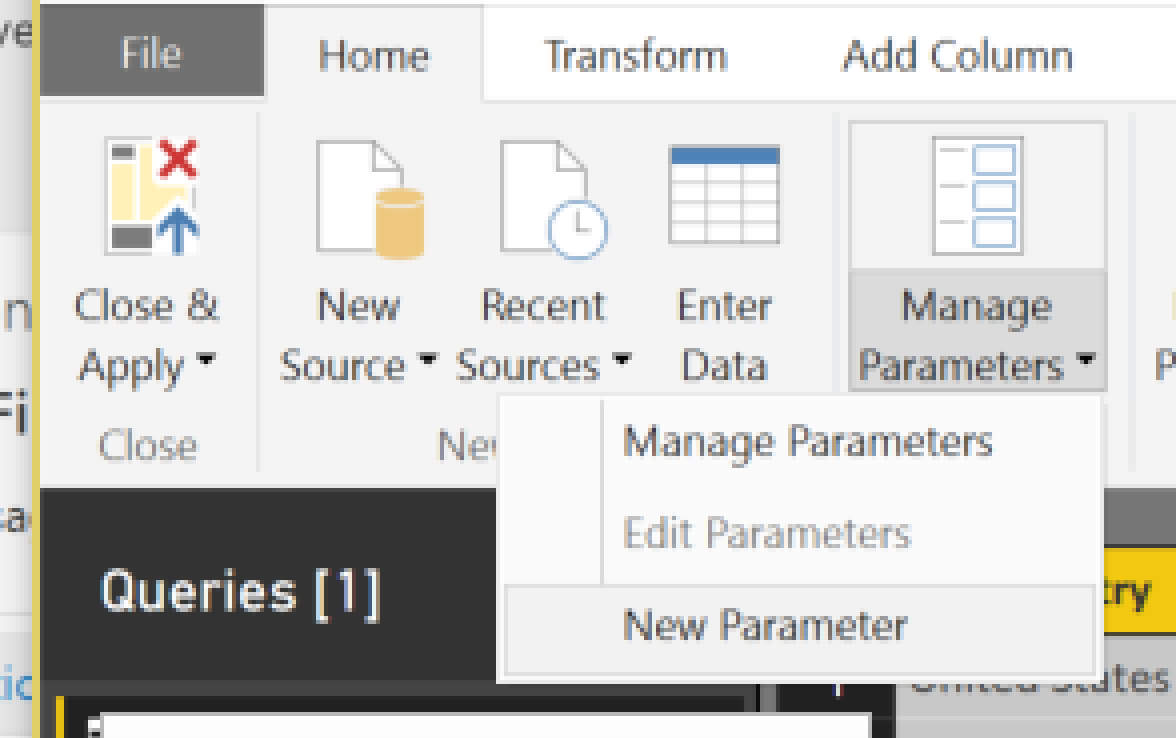
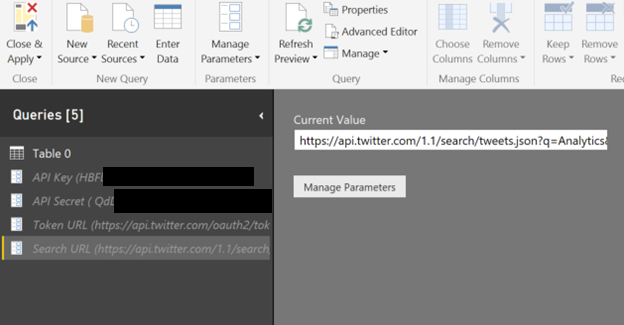
Create 4 new parameters as follows:
API KEY: <<your API Key>>
API Secret: <<your API Secret>>
Token URL: https://api.twitter.com/oauth2/token
Search URL: https://api.twitter.com/1.1/search/tweets.json?q=Analytics&count=100
Notice the Search URL has a couple of query string parameters. In my example we will be searching on the word “Analytics”
Once the parameters are entered you will see them in the queries list with their values along with the arbitrary table you pulled in from the Web data source
Advanced Editor
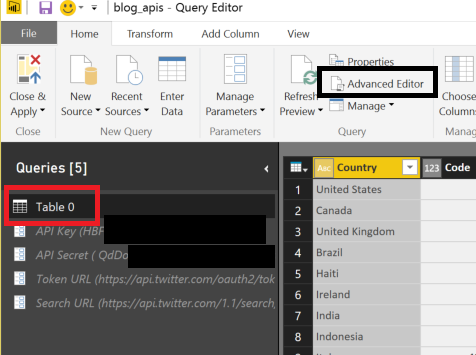
Now that we have our parameters in place, navigate back to the Table Query and click on “Advanced Editor”
Once in the advanced editor, replace the script with the following:
/*
This M script gets an bearer token and performs a tweet search from the Twitter REST API
https://dev.twitter.com/oauth/application-only

Requires establishing a Twitter application in order to obtain a Consumer Key & Consumer Secret
https://apps.twitter.com/

IMPORTANT - The Consumer Key and Consumer secret should be treated as passwords and not distributed
*/

let
 // Concatenates the Consumer Key & Consumer Secret and converts to base64
 authKey = "Basic " & Binary.ToText(Text.ToBinary(#"API Key" & ":" & #"API Secret"),0),
 url = "https://api.twitter.com/oauth2/token",
 // Uses the Twitter POST oauth2/token method to obtain a bearer token
 GetJson = Web.Contents(url,
     [
         Headers = [#"Authorization"=authKey,
                    #"Content-Type"="application/x-www-form-urlencoded;charset=UTF-8"],
         Content = Text.ToBinary("grant_type=client_credentials")
     ]
 ),
 FormatAsJson = Json.Document(GetJson),
 // Gets token from the Json response
 AccessToken = FormatAsJson[access_token],
 AccessTokenHeader = "bearer " & AccessToken,
 // Uses the Twitter GET search/tweets method using the bearer token from the previous POST oauth2/token method
 GetJsonQuery = Web.Contents("https://api.twitter.com/1.1/search/tweets.json?q=Analytics&count=100",
     [
         Headers = [#"Authorization"=AccessTokenHeader]
     ]
 ),
FormatAsJsonQuery = Json.Document(GetJsonQuery)
in
    #"FormatAsJsonQuery"
In the above code, there are two calls to Web.Contents function. The first is to call the token service to get a token returned to then be used in the second service call to actually get results.
OAuth is a preferred authentication method as the token that is returned from the first service is only valid for a finite period of time. So if you were to manually reproduce this token and then just called the search service with it, it would no longer be valid the next time you tried to refresh this data.
That is why the script above is so powerful as it handles the token generation so that you have a repeatable automated process. Kudos to @cjkoester for putting this script together.
A couple other things to note in the script is the use of our parameters. They are prefixed with the “#” sign. Also, not all OAuth services will follow the same signature above but this can be used as an example and ideally your development team can tell you changes you may need to make in the pattern to work.
I renamed the query to “TwitterSearch”. The result should now look similar to this.
Working with the JSON response
JSON (javascript object notation) is the most popular format used for transmitting data for modern APIs. XML is also still widely used and if your APIs return XML it is likely many of these same steps will apply.
I am really impressed with the JSON parser that is built into the query editor of Power BI. For instance, when you look at the results of the JSON that gets returned in the Twitter API that we just connected to, it looks like this:

I can count 6 levels of nesting in the small portion of the JSON response I am showing above (via Fiddler). The Power BI Query Editor handles this with no issues.
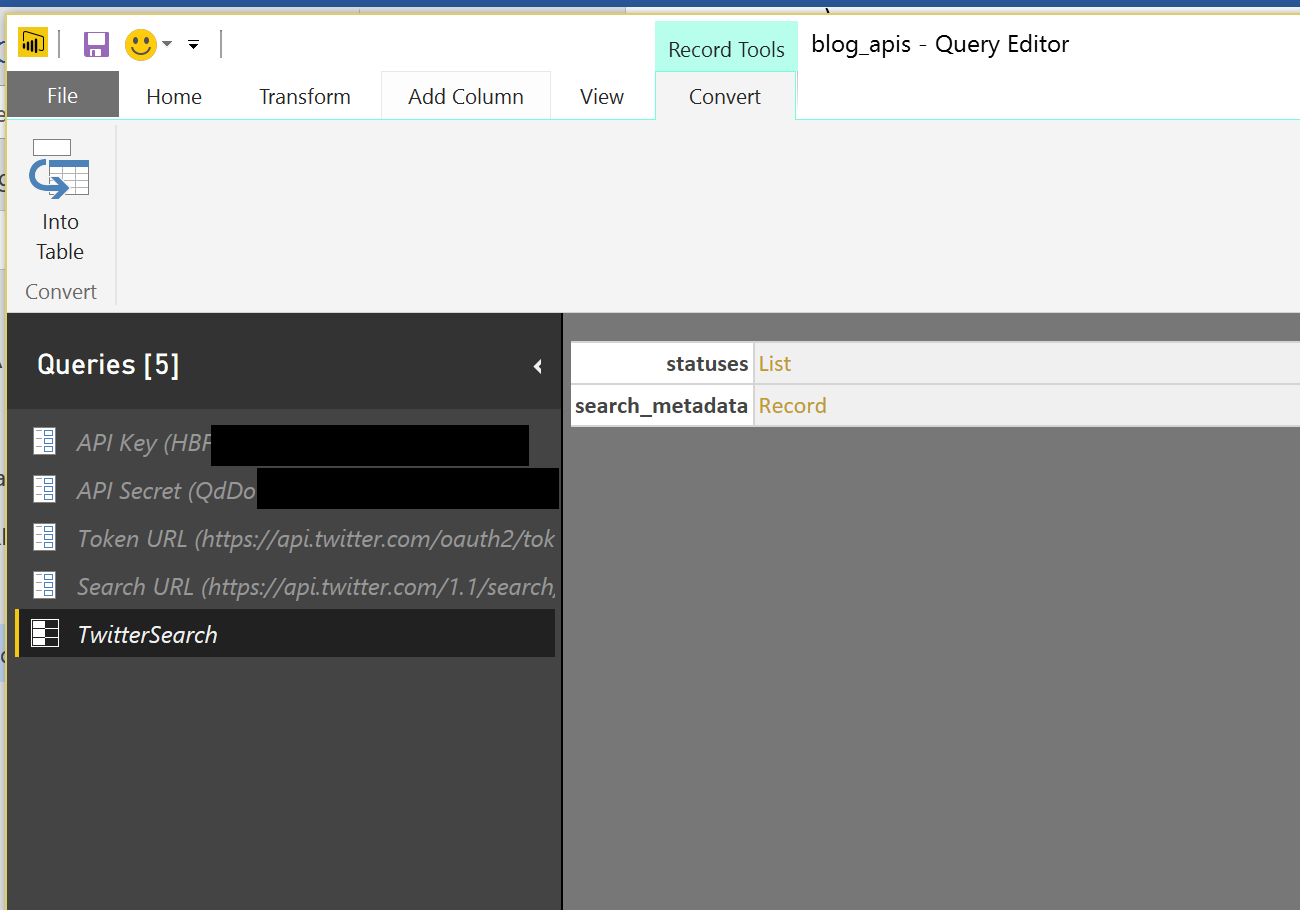
We will create two separate queries from this response, one for the statuses and the other for the hashtags.
Taking the TwitterSearch result, the two top level entities are “statuses” and “search_metadata”. Click the “List” value for “statuses” and this will expand the record set for “statuses”.

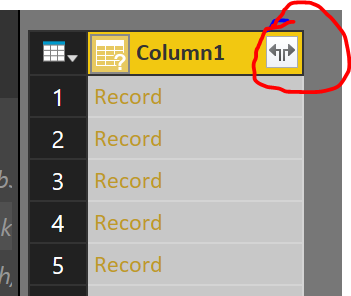
Notice the “To Table” option at the top, by changing this list to a table, we will be able to expand the Record to all the values. Click “Ok” in the To Table dialog and you will see the magic expand button pop up in the column header.
Click the button and then uncheck the “Use original column name as prefix” to avoid the “Column1” showing up as a prefix for to every column created.
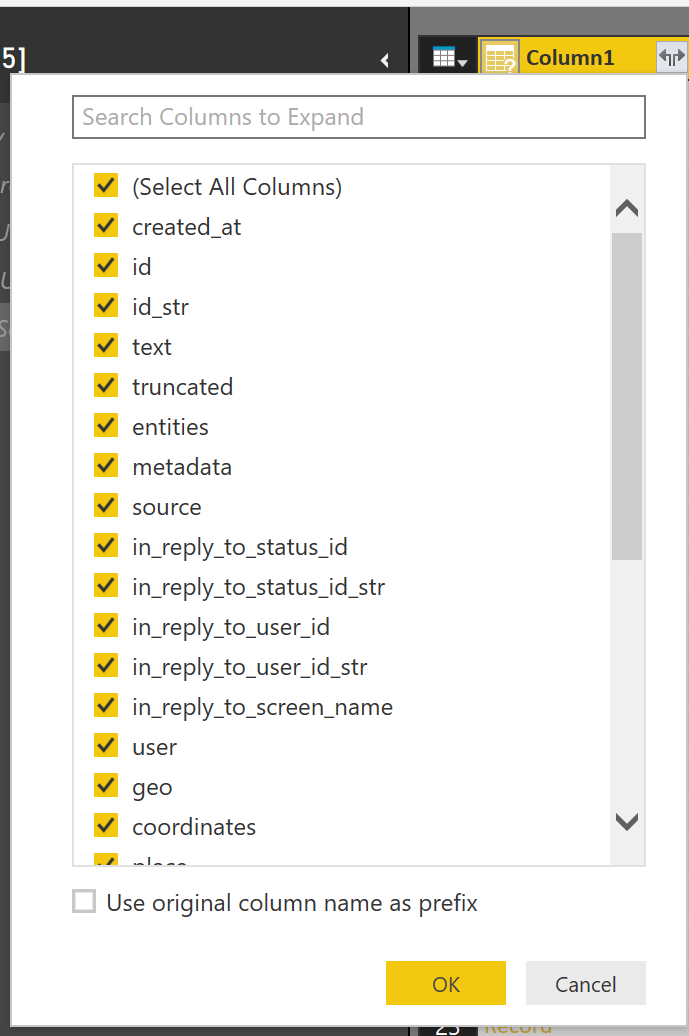
Click Ok.
Congratulations! You now have the last 100 statuses for the search term “Analytics” that we used in the search URL string we entered as the parameter above: https://api.twitter.com/1.1/search/tweets.json?q=Analytics&count=100
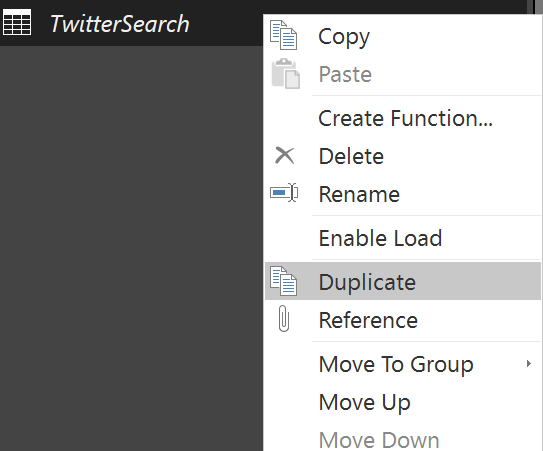
Let’s use this same result to create an additional query for hashtags. Simply right click on the “TwitterSearch” query and select “Duplicate”
Rename the query “Hashtags”.
Find the “Entities” column and click the magic expand button again.

On the column expansion dialog simply click “Ok” again to see all the results of the nested JSON document.
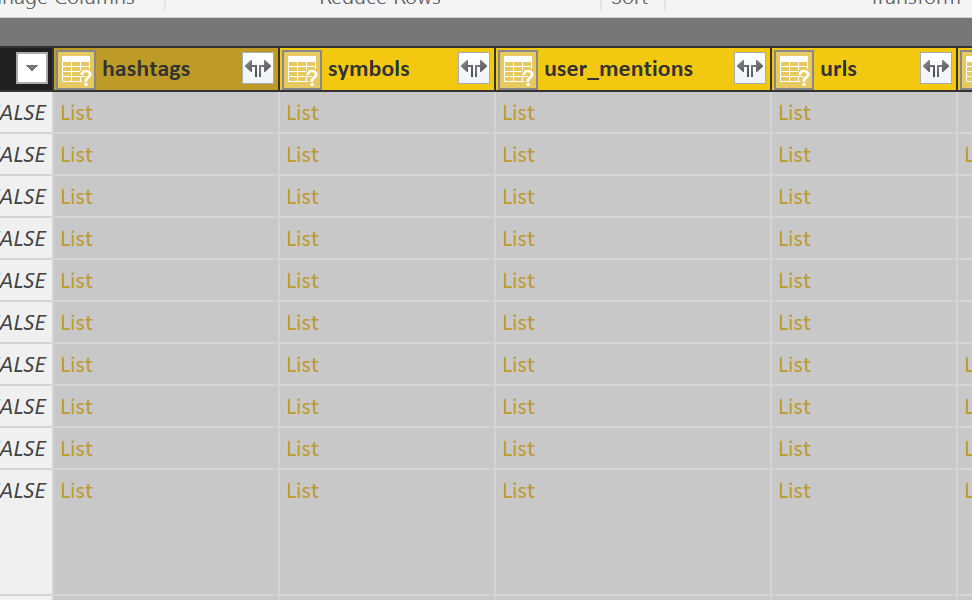
Click the magic expand button again on “hashtags”.
This will bring in the null values and the “List” links will become “Record” links.
Finally click the magic expand button one last time to be greeted by the hashtag records we wanted.
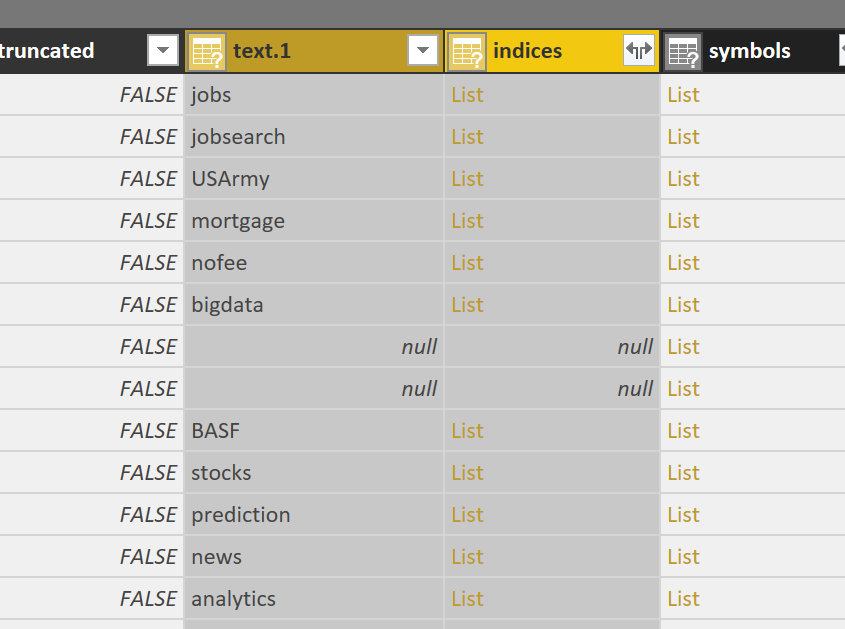
Right click “text.1” and rename it “hashtag”.
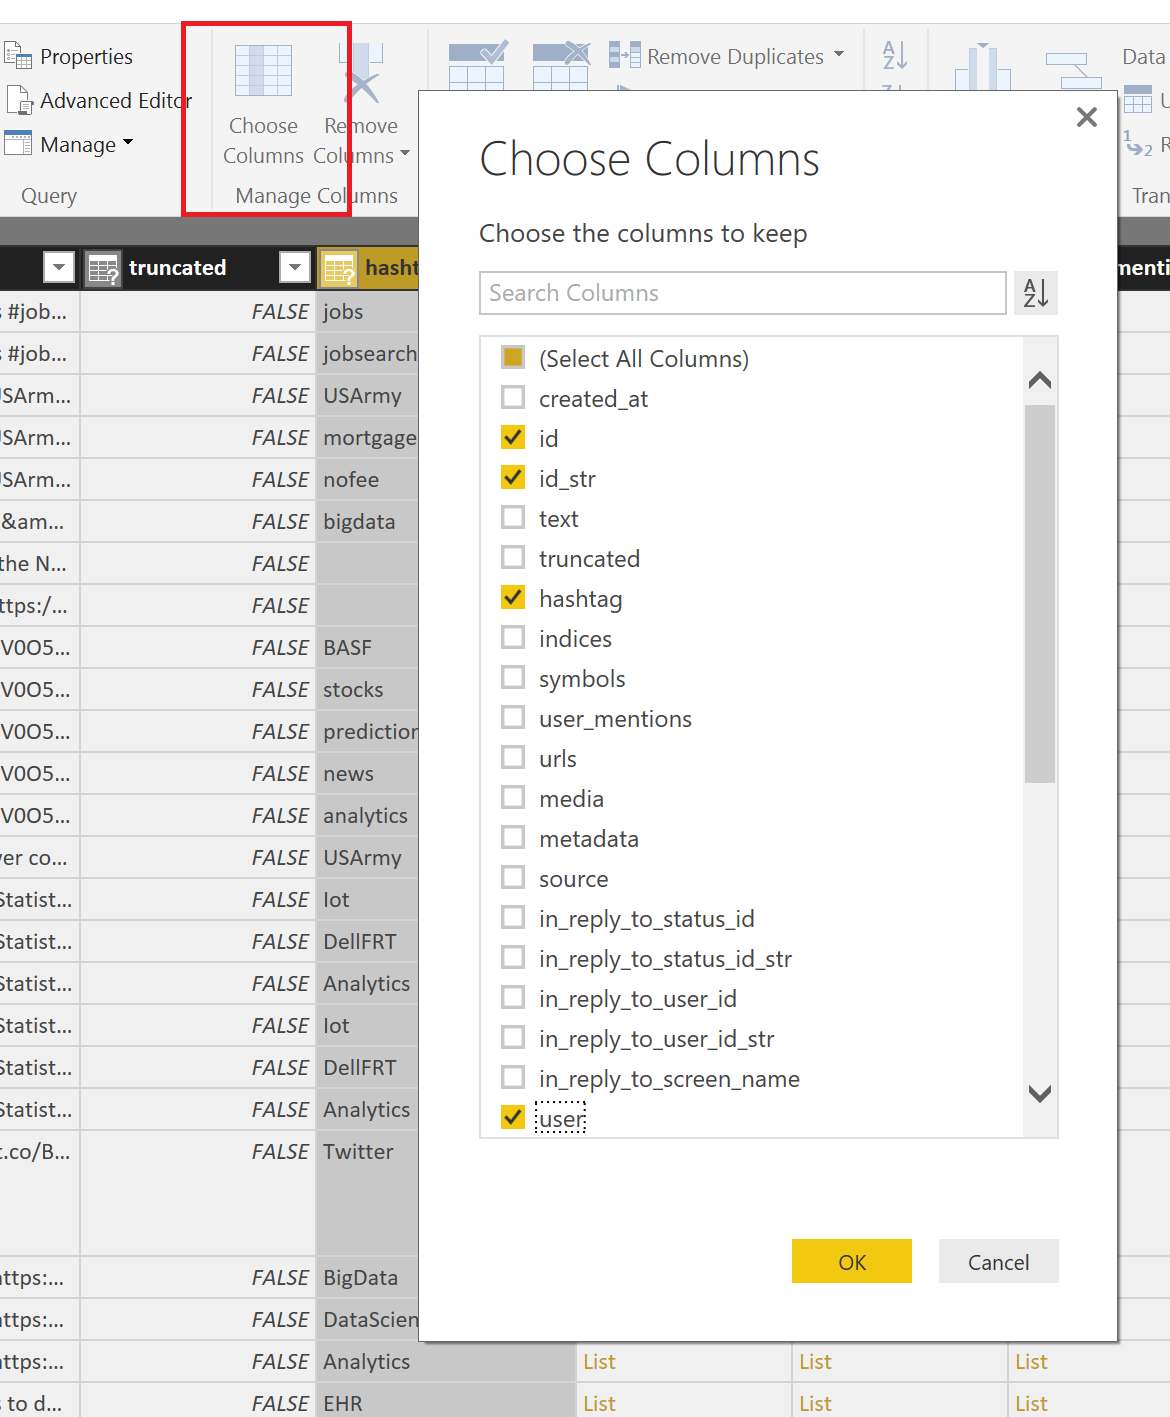
Now we can use the “Choose Columns” dialog to only select a few of the columns to reduce our query to just the information important to the hashtags.
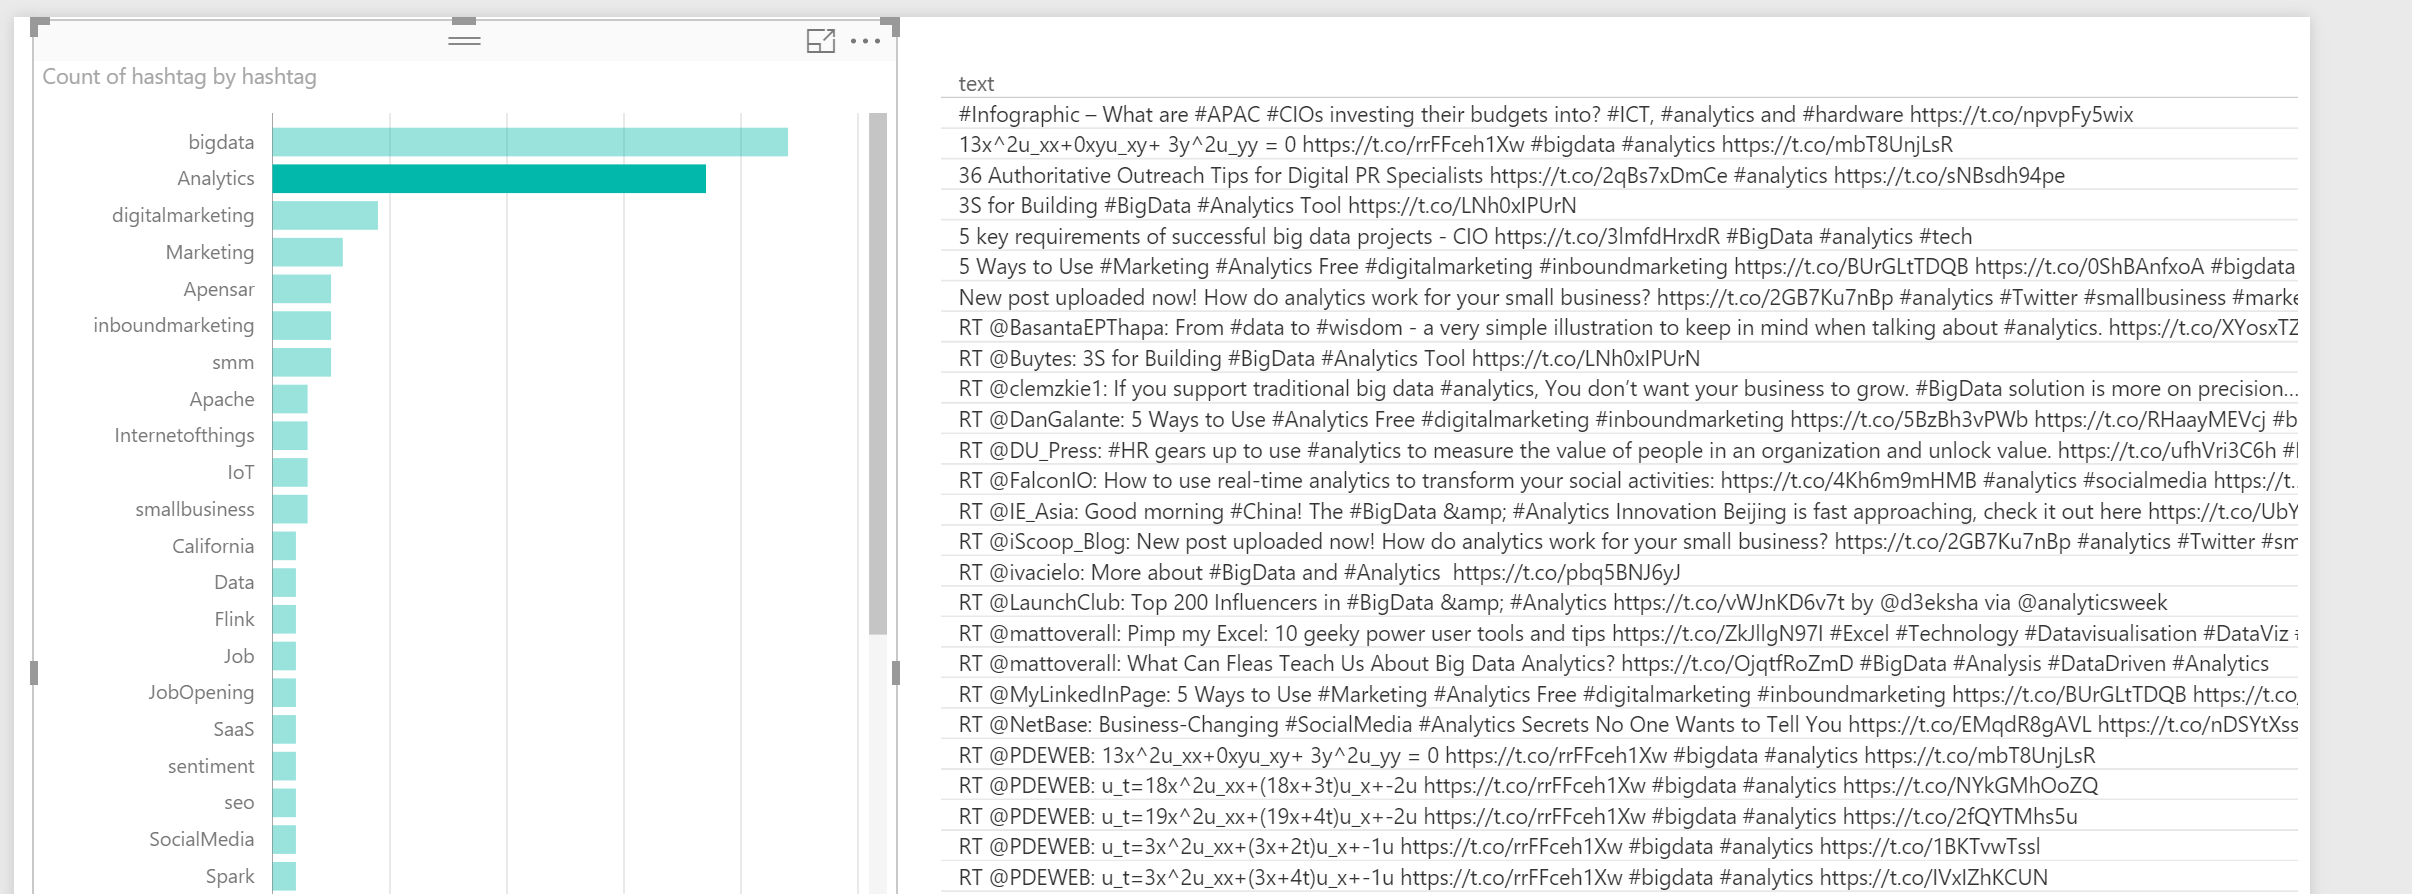
From here you can “Close and Apply” your Query Editor window and will have two queries. One for the statuses of your twitter search and the other for the hashtags that you can cross filter against.
A simple viz may look like this
Power BI Template
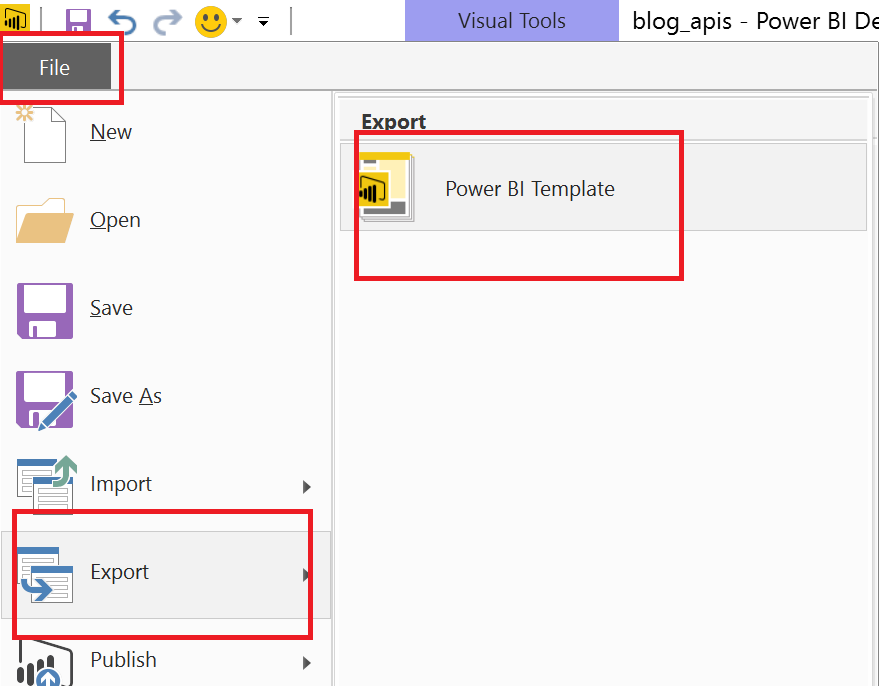
Another new feature in the April update of Power BI is the Power BI Template file. I have saved all of the above work in a template file that I am sharing by clicking the Export option from the File menu.
This retains all of the work that has been completed above but doesn’t retain any of the data. So when you open this template file, it will prompt you for the parameters that were discussed above.
Here is the template file link again. Angry Analytics Twitter API Example
Conclusion
In closing, this article was intended to show you multiple ways that you can connect to APIs as it is likely your organization has set standards around data connectivity that no longer allows connecting directly to the source.
Be an advocate for a Data Culture. Putting data in the hands of more people as quickly as possible will result in the ability to achieve more. Challenge your development teams to make data accessible. Data is currency!